I was recently asked by a course participant what program could be used to help them automate the creation of their monthly report.
Their current process was to copy data from a web based source, paste it into Excel. Then use a variety of functions, such as LEFT(), MID(), RIGHT(), TEXTJOIN() and VLOOKUP() to manipulate various columns. The resulting information was then fed into a Pivot Table, then into a Pivot Chart and then used in another report. And then the next month they had to do this all again.
They were surprised when I said that this could all be done within Excel using Power Query, without having to use another program, and that with Power Query it’s ’do once – use multiple times’.
Power Query is in my opinion one of the most unknown and under-utilised features in Microsoft Excel. Power Query can save hours of time with reports, dashboards, pivot tables and charts being updated with data refresh.
Power Query also works with Power BI, Power Apps, Dynamics 365 and more. Check out our free webinar on the 24th August at 11am-12pm. Save your spot and register today.
What is Power Query?
Power Query is known as an ETL tool. A tool that Extracts data from multiple sources allows you to Transform that data and then choose where to Load it to – a worksheet, the Excel data model or directly into a PivotTable.
These transformation steps can then be saved and used for future imports. They can even be edited if the source data or output requirements change.
Power Query features include:
- Changing text case
- Changing data type
- Rounding
- Splitting or combining columns
- Creating calculated columns and more…
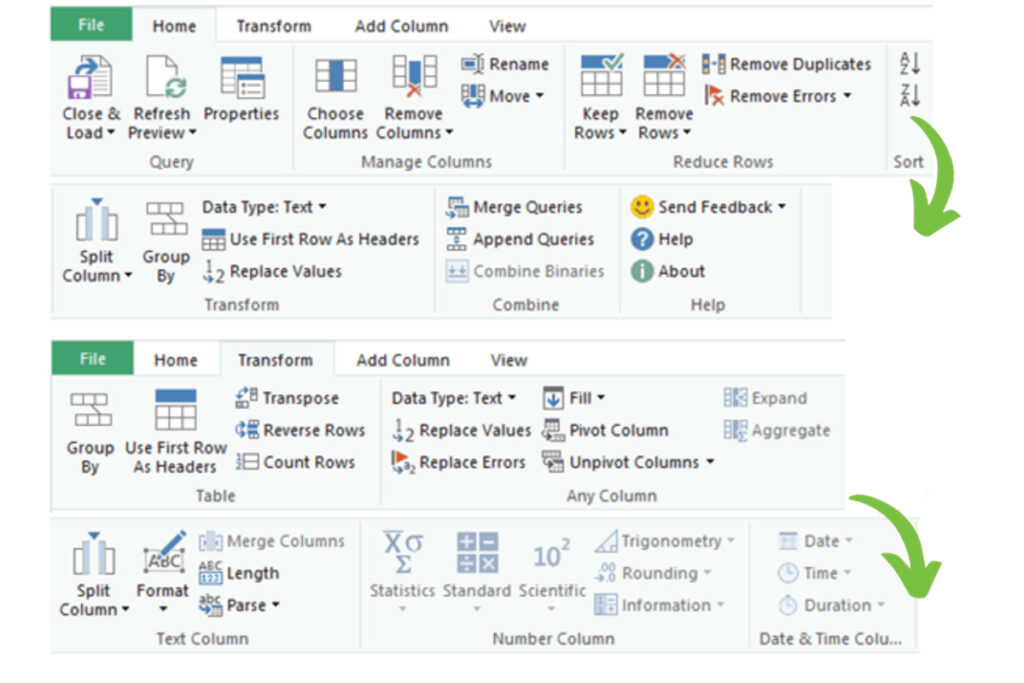
Power Query can even extract the Month name from a date column, delete columns, remove rows, or replace one piece of text with another. The Merge Query feature can be used to eliminate the need for VLOOKUPs in your workbooks. It will even allow for ‘fuzzy’ matching.
In fact, over 350 data transformation options are available with Power Query. Here’s a look at the main features:

How did we use Power Query?
The process that we used to set up their monthly reporting was:
- Use Data | Get & Transform within Excel to connect to the web address for the source data
- Use the transformation tools within Power Query to perform the splitting and combining of data, as well as merging with the table they used to do the VLOOKUP() against.
- Then the data was loaded into an Excel table
- From this a Pivot Table and Pivot Chart was created
- Then the final report/dashboard was updated.
So each month, all they had to do was choose Data | Refresh All from the ribbon in Excel and the new data was processed and incorporated in the Pivot Chart. The charts and summary then automatically updated into the final report/dashboard.
What if the data is not web based?
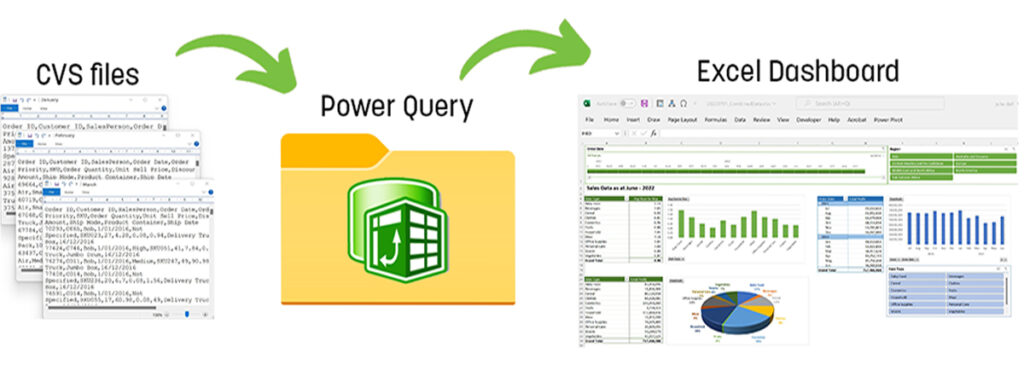
Power Query can be used for a wide variety of data sources – databases, text files, csv, Azure and the Dataverse being some of them. You can even connect to a local folder, where a new data dump can be added on a regular basis and incorporated directly into a dashboard.

Interested in knowing more about Power Query?
If you want to gain an insight into the Power tool, we have a free webinar on the 24th August at 11am till 12 noon. Save your spot and click here to register today.
Check out our Microsoft Excel – Analysing Data using Power Query course at ATI-Mirage and the whole suite of Automation training starting with Excel and Power BI to maximise your technology investment. Call +61 08 9218 9059 to book more training today with ATI-Mirage.
Blog written by Julie Dall, ATI-Mirage’s Senior Consultant IT.


